Construction Reference Charts & Visual Guides
The blueprint-style diagrams on this page are original visual assets created to support and explain the assumptions used across our concrete, asphalt, aggregates, masonry, framing, and roofing calculators. They are designed for planning-grade estimating, use them to understand the reasoning behind each calculator's defaults, then adjust inputs to match your specific job.
Prepared by: K. Lynch, Home Project Calculator
Last updated: · Version 1.0
Concrete Thickness Chart & Slab Cross-Section Guide
Concrete estimates are only as good as the assumptions behind them. Thickness, reinforcement, base prep, and soil conditions can change both performance and cost. The diagrams below explain the most common slab assemblies and why slab thickness increases with load, soil risk, and frost exposure.
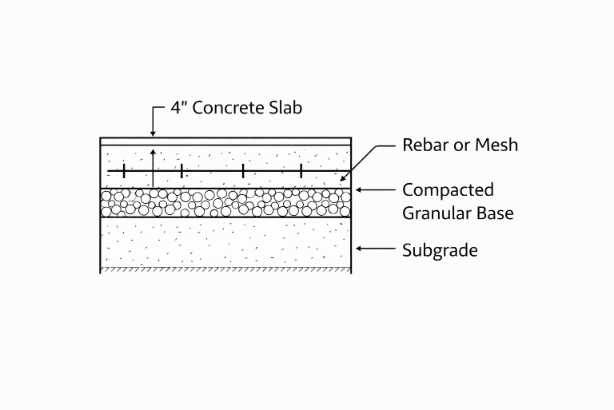
What this slab cross-section is showing
- Concrete slab thickness: many residential slabs start around
4", but that is not universal. - Rebar or mesh: reinforcement helps manage cracking and load distribution, exact size and spacing varies by design.
- Compacted granular base: a stable base reduces settlement risk and helps drainage under the slab.
- Subgrade condition: weak or organic soils, fill, or expansive clays may require different details entirely.
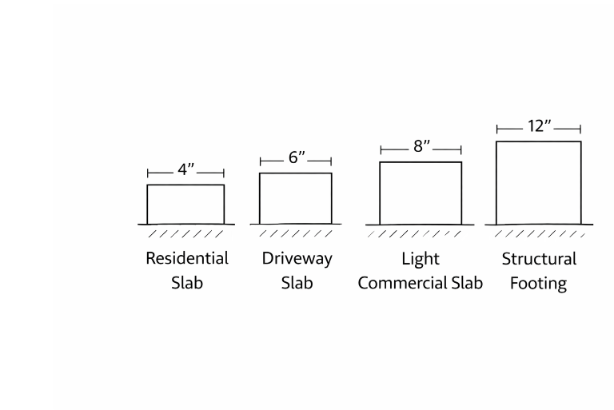
When thickness typically increases
- Loads increase: vehicles, equipment, storage, or concentrated point loads.
- Subgrade is uncertain: soft spots, fill, or poor compaction under the slab.
- Edges need support: thickened edges or integrated footings for walls, posts, or door openings.
- Climate risk exists: frost depth and freeze/thaw cycles can change required details.
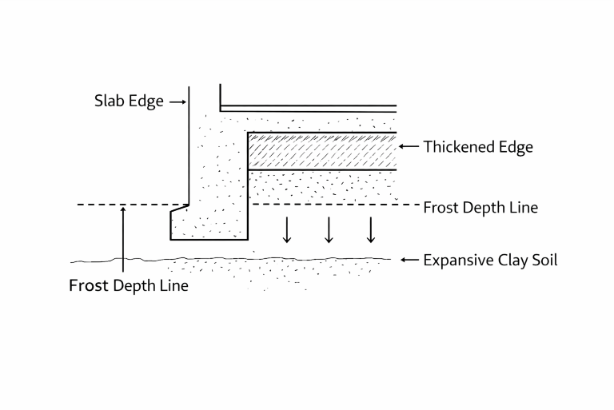
Frost, drainage, and soil behaviour
In regions with freezing conditions, moisture in soil can expand and lift slabs. Expansive clays can swell and shrink with moisture changes independently of frost. Use this diagram to identify risk factors you should confirm before ordering concrete or setting forms.
Related calculators
For default slab thickness ranges, base assumptions, and waste allowances, see Calculation Assumptions.
Asphalt Compaction Chart & Layer Structure Diagram
Asphalt estimates commonly go wrong in two places: assuming surface thickness without designing the base, and forgetting that asphalt is placed loose and then compacted. These diagrams show a typical pavement stack and the compaction effect to plan for when ordering.
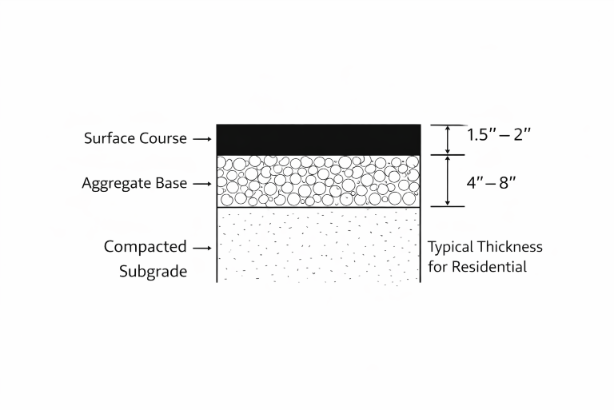
Typical thickness ranges (planning reference)
- Residential: often around
2–3"compacted surface, project-dependent. - Commercial / heavier use: commonly
4–6"compacted total asphalt depending on design. - Base matters: weak base and subgrade are a frequent cause of rutting and premature failure.
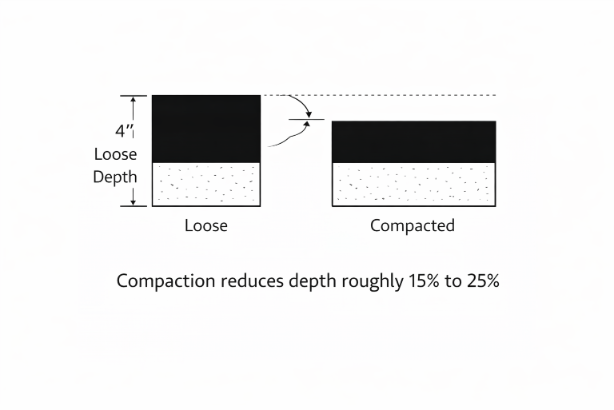
Why compaction changes ordering
Asphalt is placed loose and then densified by rolling. The final compacted thickness depends on mix design, temperature, lift thickness, roller strategy, and site conditions. That is why our calculators treat compaction and density as adjustable inputs rather than fixed numbers.
Related calculators
Building Material Density Chart (Concrete, Asphalt, Aggregates)
Many estimating mistakes are unit mistakes: suppliers quote tons while plans start in cubic feet or cubic yards. Density bridges that gap. The chart below summarises typical density ranges for common materials so you can understand why two suppliers can quote different tonnages for the same volume.
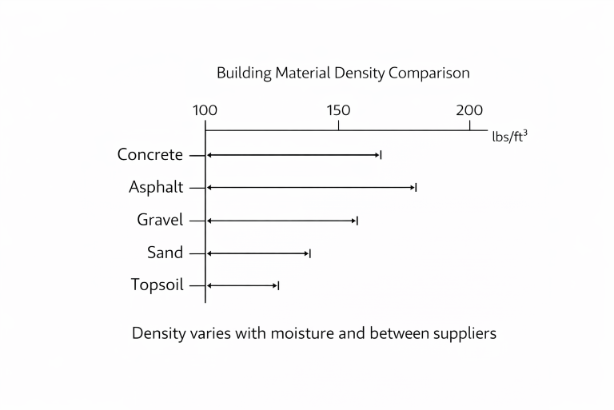
Typical density ranges (quick reference)
- Concrete: commonly ~
140–150 lb/ft³(mix design and air content affect this). - Asphalt: often ~
135–145 lb/ft³(depends on mix and compaction). - Crushed stone / gravel: often ~
100–120 lb/ft³(gradation and moisture matter). - Sand: often ~
95–110 lb/ft³(moisture can shift results noticeably). - Topsoil: often ~
75–100 lb/ft³(organic content and moisture vary widely).
This is why our aggregate and landscaping calculators include a density override: it lets you match the tool to the supplier's delivery ticket or local typical values rather than a one-size-fits-all estimate.
Related calculators
See Data Sources for where default densities come from.
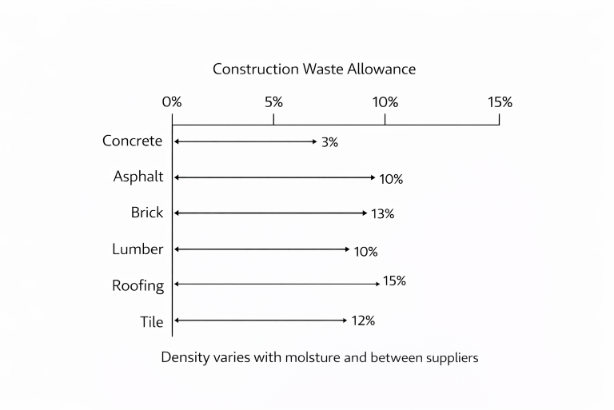
Construction Waste Percentage Chart (Planning Allowances)
Waste is a realistic allowance for cutting, breakage, spillage, and site variability, not a sign of poor planning. The goal is to avoid running short mid-project, especially when delivery windows, batch matching, or crew scheduling are involved.
Why waste increases on real jobs
- Layout complexity: more corners, angles, and penetrations create more cuts.
- Substrate variation: out-of-square rooms and uneven grades increase trimming and correction.
- Handling loss: brittle materials break; bulk materials spill or settle.
- Rounding to units: bundles, bags, and pallets rarely match the exact calculated quantity.
Default waste ranges are published for transparency. See Calculation Assumptions for category-by-category defaults.
Helpful next step
Pair this page with our Project Planning Checklists to reduce under-ordering and missed prep steps.
Rebar Spacing Diagram & Rebar Placement Depth (Slab Reinforcement)
Reinforcement is one of the most misunderstood parts of slab planning. People often focus on how much rebar to buy, but placement and spacing matter just as much as quantity. Use these diagrams to understand common grid layouts and why bar elevation and cover affect performance.
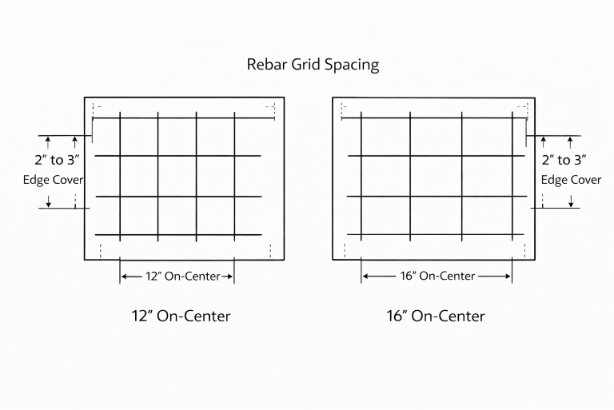
Spacing: what "O.C." means in practice
"On-center" spacing is measured from the centre of one bar to the centre of the next. Closer spacing increases reinforcement density but also changes labour and material cost. Your slab's intended use, load, and local requirements should drive the final spacing decision.
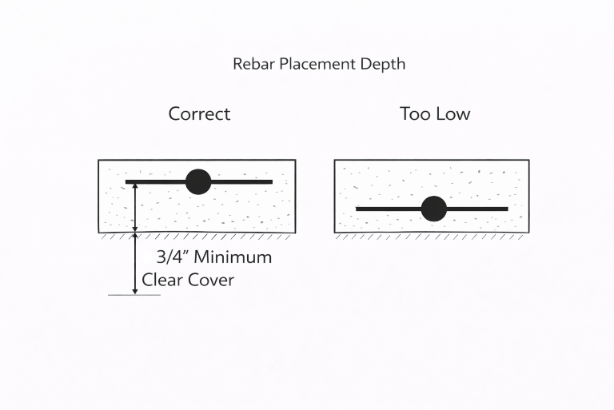
Placement depth: why "too low" is a common failure
- Crack control and load distribution: reinforcement works best positioned where tensile stresses occur.
- Clear cover: bars need sufficient concrete cover to reduce corrosion risk and maintain performance.
- Support matters: chairs and ties keep steel in position during the pour.
Related calculators
Roof Pitch & Multipliers (Squares, Slope Factors, and Waste)
Roofing estimates are driven by three realities: roof area increases with pitch, complex shapes create cut waste, and roofing is ordered in squares and bundles rather than exact square footage. The diagram below ties those concepts together so you can sanity-check your calculator inputs.
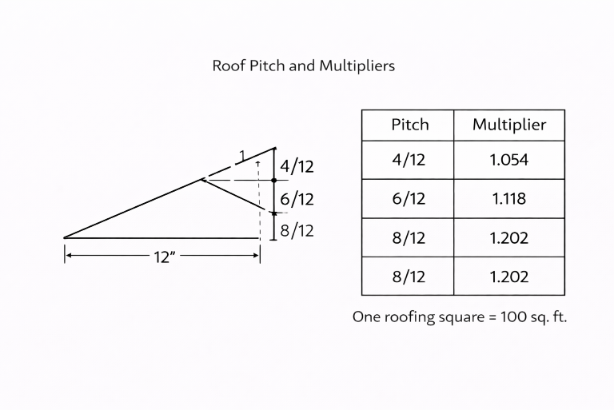
Pitch multipliers (quick reference)
A pitch multiplier converts the footprint (horizontal) area into sloped surface area. Your roof's geometry and complexity still matter, but multipliers are a reliable planning tool.
| Pitch | Typical Multiplier | Notes |
|---|---|---|
4/12 | ~1.05 | Common on lower-slope roofs |
6/12 | ~1.12 | Moderate slope; increased surface area |
8/12 | ~1.20 | Steeper slope; higher waste risk on complex roofs |
Multipliers are planning references. Final quantities change with dormers, valleys, hips, and manufacturer system requirements.
Related calculators
Methodology, Review, and How to Use These Charts
Each visual on this page is built to make our estimating defaults easier to understand. Where possible we publish ranges rather than single figures, because materials vary by supplier, moisture, compaction, and job conditions.
1) Confirm assumptions
Before ordering, confirm thickness, waste, compaction, and density values match your project.
Go to Calculation Assumptions →2) Understand our formulas
We document how calculators convert measurements into volume, weight, and purchase units.
Go to Methodology →3) Verify sources
We publish data sources and how pages are reviewed so users can trust the defaults or override them.
Want a chart added for masonry, framing, aggregates gradation, or roofing accessories? Contact us.